Merchants’ sales up 5.3% in April compared to last year
Year on year
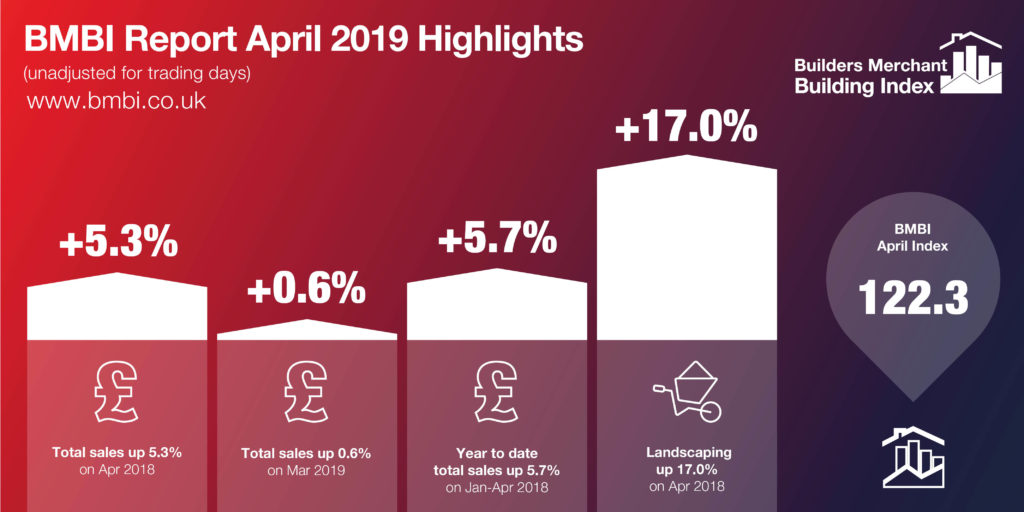
Total Builders Merchants value sales in April 2019 were up 5.3% compared with the same period in 2018. Having seen strong growth in both February and March, sales in the seasonable Landscaping category continued to improve in April and were up 17% compared to last year, as the weather stayed drier than usual. Timber & Joinery Products and Heavy Building Materials performed well, with sales growth of 5.5% and 4.5% respectively.
According to the ONS, the overall construction industry experienced a muted April as their figures for the month revealed that overall construction output was 2.4% higher than in April 2018, while in the monthly comparison, output declined by 0.4% compared with March 2019.
Month on month
Total Builders Merchants sales were up 0.6% compared with the previous month, though all categories except Landscaping and Services saw sales decrease in April. However, the adjusted April 2019 figures, which take into account the trading day difference, show that total sales increased 5.6% over March.
Sectors that performed well on a month-by-month adjusted basis included Landscaping (up 23.3%), Heavy Building Materials (up 4.9%) and Timber & Joinery products (up 4.2%), while Plumbing, Heating & Electrical (down 5.9%), Tools (down 4%) and Kitchens & Bathrooms (down 1.5%) were less strong.
Other periods
The rolling 12 months May 2018 to April 2019 were 4.8% above the same period a year earlier, with one less trading day. Landscaping did best (up 10.5%). Average sales a day in the period were 5.3% higher.
Index
April’s BMBI index was 122.3, with Landscaping the highest category at 154.5, but most other sectors, with the exception of ironmongery, were below the Total Builders Merchants index. The average sales a day index for April was 126.9.
Produced by MRA Marketing, the Builders Merchant Building Index report contains data from GfK’s Builders Merchants Panel, which analyses data from over 80 of generalist builders’ merchants’ sales throughout Great Britain. The full report with index tables and charts is available to download at www.bmbi.co.uk/.